
TL;DR
- A Log-Normal distribution appears to be a surprising good fit to the number of new cases in various countries
- The log-normal is able to predict the future growth of the virus assuming no later waves
- It's highly probable that the number of cases are under reported
- The idea of flattening the curve
iscan be misleading [Updated 5/18/2020] - There are many populous countries that are just starting to "blow" up.
My Goal
We all have our own way of coping with the current pandemic. For me it was looking at the numbers to see if I could understand where we were heading. I feel that much of what is presented in the media is dumbed-down for the general population and wasn't answering the questions that I was asking in the way I wanted them answered.
My goal was to find a mathematical function that fit the data that could reveal the potential size of this pandemic. I looked at the growth for various countries with different strategies. I also picked countries that were further in the cycle so that the data would be more revealing.
- South Korea
- Italy
- Spain
- Germany
- United States
I used Python's pandas, scipy modules, which allowed for quick processing of the data, a rich collection of mathematical functions and as a bonus, a curve fitting algorithm.
Log-Normal Distribution
After several attempts of identifying a function, tracking its fit over days or weeks, I found the best fit was a Log-Normal distribution. This is the same function I identified in a previous post for fitting income/wealth distributions [1]. In that context, it makes sense that a log-normal fits this pandemic. At the beginning, there is exponential growth and the entire population is a candidate for infection. This results in rapid growth at the beginning. Then, as more people have had it, there are fewer candidates so the tail dies off more slowly.
Plots
Here are my attempts at fitting a log-normal distribution to the number of new cases for various countries. The actual data is a solid blue line and the dashed orange line is the log-normal estimation. The legend for the log-normal shows the estimate for total number of cases, e.g. "3.01M" is 3.01 million.


Curve Fit Parameters
The curve fit parameters for a log-normal are scale, sigma and offset. These are useful in the following ways:
- scale - provides an overall estimate of the number of cases
- sigma - provides the shape (how wide or narrow)
- offset - provides the starting date
Table of fitting parameters for each Country (sorted by start date)
| Country | Scale (# Cases) |
Sigma | Offset (Days) |
|---|---|---|---|
| South Korea | 9,100 | 0.76 | 55 |
| France | 141,500 | 0.35 | 57 |
| Italy | 246,000 | 0.55 | 58 |
| Spain | 226,100 | 0.39 | 63 |
| Germany | 175,700 | 0.43 | 63 |
| United Kingdom | 530,100 | 0.82 | 75 |
| United States | 3,010,500 | 0.88 | 76 |
Pythons scipy.stats.lognorm includes the functions pdf (probability distribution function), cdf (cumulative probabilty function), and ppf (percent-point function). The ppf was used to determine dates for when each country would achieve some level of percent complete.
[Updated 6/4/2020. Add to table below date when actual % was reached. Green/Yellow/Red indicate how close the prediction was. This shows how hard it is to predict the future since most of the green dates were before the prediction was made]
Table of % Complete (Assuming Log-normal) Predicted on May 9, 2020
Table of Population and Estimated Percentage Infected
There is a lot of talk about "Flattening the Curve". This is the idea that by taking measures, we don't decrease the total number of cases, just spread it out over time. This is misleading on various fronts.
 The second plot is using a logarithmic scale. It appears the curve is flattening, but this is the same data. It's only flattening because tick marks at the top represent much large jumps, flattening the curve.

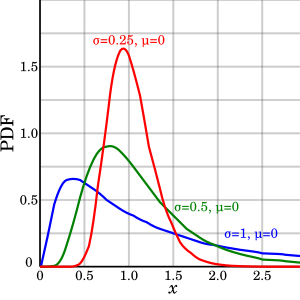
Another idea is that by flattening, we are spreading the data over time. For the log-normal, this would mean varying sigma, since scale and offset are assumed fixed. While a larger sigma lowers the peak, it also pushes the rise further left. This doesn't agree with the "flattening the curve" concept. Lowering the peak should push the peak right, not left.
If you looked at the sigma for each country and estimated percentage infected, there is no real correlation. The only thing that makes sense is that extreme intervention lowers the number of cases. Countries like South Korea and Germany had the most extreme intervention (0.02% and 0.22% infected) and the US with a relatively poor response has the highest (0.92%)
[Updated 5/18/2020 with Scale] It appears scale is correlated to the total number infected, so flattening the curve may be possible.

Data Used: https://covid.ourworldindata.org/data/owid-covid-data.csv
[Updated 6/4/2020. Add to table below date when actual % was reached. Green/Yellow/Red indicate how close the prediction was. This shows how hard it is to predict the future since most of the green dates were before the prediction was made]
Table of % Complete (Assuming Log-normal) Predicted on May 9, 2020
| Country | 50% | 67% | 95% | 99% | 99.9% | 99.99% |
| South Korea | 3/4/2020 3/2-3/3 |
3/8/2020 3/5-3/6 |
3/28/2020 3/19-3/20 |
4/20/2020 3/23-3/24 |
6/4/2020 3/24-3/25 |
8/5/2020 3/24-3/25 |
| France | 4/7/2020 4/6-4/7 |
4/13/2020 4/12-4/13 |
5/9/2020 5/6-5/7 |
5/29/2020 5/12-5/13 |
6/26/2020 5/15-5/16 |
7/27/2020 5/15-5/16 |
| Italy | 4/5/2020 4/4-4/5 |
4/16/2020 4/15-4/16 |
6/2/2020 6/3-6/4 |
7/16/2020 | 9/28/2020 | 12/26/2020 |
| Spain | 4/4/2020 4/1-4/2 |
4/10/2020 4/7-4/8 |
5/4/2020 4/29-4/30 |
5/23/2020 5/8-5/9 |
6/20/2020 5/9-5/10 |
7/21/2020 5/9-5/10 |
| Germany | 4/5/2020 4/4-4/5 |
4/12/2020 4/11-4/12 |
5/10/2020 5/7-5/8 |
6/2/2020 5/16-5/17 |
7/8/2020 5/19-5/20 |
8/17/2020 5/19-5/20 |
| United Kingdom | 5/23/2020 5/26-5/27 |
6/22/2020 | 12/6/2020 | 6/23/2021 | 8/3/2022 | 3/13/2024 |
| United States | 5/19/2020 5/18-5/19 |
6/19/2020 | 12/18/2020 | 8/6/2021 | 12/9/2022 | 12/21/2024 |
Under Reporting
I personally know many people that have claimed to have COVID-like symptoms but were never even tested. The curve fitting model presented above supports those claims, since the "Scale" or estimated total number of cases is far below each countries populations. The highest percentage of estimated cases is United States at around 1%. The remaining 99% are a mix of "not yet infected", "immune" and "infected and not reported". Since the uninfected are susceptible to getting infected, this should result in a potential resurgence. In the case of South Korea and Germany where stricter containment was used, the uninfected is probably a larger portion of the population.Table of Population and Estimated Percentage Infected
| Country | Population | % Infected |
| South Korea | 51M | 0.02% |
| France | 67.0M | 0.21% |
| Germany | 83.1M | 0.22% |
| Italy | 60.6M | 0.41% |
| Spain | 46.7M | 0.48% |
| United Kingdom | 67.1M | 0.79% |
| United States | 328.2M | 0.92% |
Flattening the Curve
There is a lot of talk about "Flattening the Curve". This is the idea that by taking measures, we don't decrease the total number of cases, just spread it out over time. This is misleading on various fronts.Logarithmic Scale
Many sources plot the data with the number of cases on a logarithmic scale. Below are plots of the CDF (Cumulative Distribution Function) with fitted data. The first plot is a linear scale. While the rate of growth is slowing, it still has a way to climb.


Spreading the Curve
[Updated 5/18/2020. Scale is one of the fit parameters and varies by country. It may be possible that scale can be changed by a countries response][Updated 5/18/2020 with Scale] It appears scale is correlated to the total number infected, so flattening the curve may be possible.
| Country | Sigma | Scale | % Infected |
| South Korea | 0.76 | 9.6 | 0.02% |
| France | 0.35 | 41 | 0.21% |
| Italy | 0.55 | 40 | 0.41% |
| Spain | 0.39 | 30 | 0.48% |
| Germany | 0.43 | 33 | 0.22% |
| United Kingdom | 0.82 | 60 | 0.79% |
| United States | 0.88 | 65 | 0.92% |
Reliability of Prediction
The reliability of predictions was evaluated by seeing if a past prediction matches the current numbers. For example, "dt-10", would be a prediction made based on the only data available 10 days ago. This shows that attempting to predict with insufficient data effects the estimation (for example, Russia and Brazil and still rising so their predictions are not reliable). The esimated number of total cases for Italy has been stable for the last 2 weeks (since it is further in the cycle) and has been steadily climbing for the US (since the US is just passing it's peak)
Other Countries
The pandemic is just starting in many of the world's most populous countries: India, Russia, Brazil, Mexico, Indonesia, Bangledesh, Pakistan, Nigeria. Many of these countries are less prepared than the rich European countries that are already passing their peaks. It's too early to tell how this will play out worldwide.Data Used: https://covid.ourworldindata.org/data/owid-covid-data.csv