I've been wanting to go back an evaluate my previous posts on the Pandemic:
Looking at the Numbers: COVID-19 New Cases
Looking at the Numbers Part 2: COVID-19 Cases in the U.S.
Looking at the Numbers Part 3: Insight into the COV-19 Pandemic using a simulation
TL;DR
- Claim: the pandemic was following a log-normal distribution
- While the log-normal is useful, the pandemic resembles a more complicated superposition of multiple log-normal distributions.
- Claim: the future can be predicted using log-normal distribution and/or percentage of population
- Partially true
- I predicted total cases for CA, FL, TX would be much larger than expected at the time (actual numbers have exceeded my prediction).
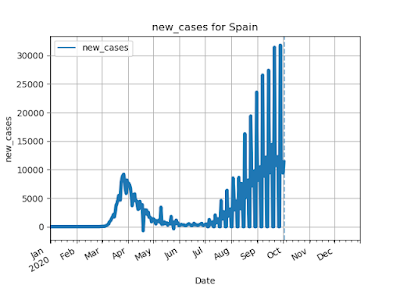
- Log-Normal cannot predict future outbreaks (Example: Italy, Russian, Japan and Spain)
- My original claim that many populous countries were just starting to "blow" up and poorer countries will most likely do worse. This is proven false in the case of Bangladesh and India with lower death rates than the U.S.
- Claim: Re-opening will most likely result in a rise of cases
- True
Log-Normal Distribution
Claim: A Log-Normal distribution appears to be a surprising good fit to the number of new cases in various countries
The claim seems to be mostly true if a country or state doesn't make major changes to their response to COVID.
For example, Brazil seems to be following a Log-Normal distribution for COVID-19 cases. Below are the best fit cumulative and distributions.
Most other countries, however show a resurgence of cases. Only the distribution function is shown. For these cases, it appears that the distributions appear as a superposition of two or more log-normal curves.
Predicting the Future
Claims:
- The log-normal is able to predict the future growth of the virus assuming no later waves
- The trend shows that the maximum expected total cases will be about 2% of the population
- Several populous states have a ways to go
The problem with this claim is that in all cases, there is a later wave. Still, I believe that the log-normal can help provide an expectation of how a current outbreak in a locale will play out. Some examples:
Second Outbreaks
On May 9, 2020, I predicted that Italy would have 246k cases. It hit this number at the end of July (as predicted) however a month later, the cases started climbing again. It retrospect, I remember looking at the regions of Italy that had been infected and I noticed there were many other populous areas with low infection rates. So I am not surprised in the later rise, but I also had no way to predict when it would start nor how large it will be.
Other countries that have had secondary outbreaks (Japan, Russian, Spain).
Populous States
On May 24, 2020, I predicted that California, Texas and Florida would have significantly more cases based on the assumption that peak cases would be about 2% of the population. This assumption of 2% ended up being too low for many states (Florida and Arizona are both over 3% of the population infected).
| State | Population | Total Cases to Date | Estimate from May 24 | Actual Oct. 3 |
|---|---|---|---|---|
| CA | 39,144,818 | 88,226 | 694,670 | 826,624 |
| TX | 27,469,114 | 52,268 | 497,114 | 766,559 |
| FL | 20,271,272 | 48,675 | 356,750 | 711,804 |
California's continually changing policies (partial shutdown, full shutdown, partial reopening, etc.) have resulted in a distribution that cannot be fit to a log-normal.
On May 9, 2020, I noted that some of the most populous countries were just starting to see the pandemic: India, Russia, Brazil, Mexico, Indonesia, Bangladesh, Pakistan, Nigeria. Though I wrote in my post that "It's too early to tell how this will play out worldwide", I alluded to my hypothesis that they would experience a more severe pandemic. The table below does not support this hypothesis.
Two cases stand out: India and Bangladesh. India is quickly approaching the U.S. in number of cases but has a death rate nearly half of the U.S. Bangladesh has an even lower death rate and the total number of cases are very small (0.2% of the population infected compared to the U.S. at 2.2%). And it appears that cases in Bangladesh are on a steady decline.

Populous Countries
| Country | May 9 | Oct 3 | Death Rate for those infected |
| United States | 1,283,929 | 7,332,285 | 2.8% |
| Brazil | 145,328 | 4,880,523 | 3.0% |
| India | 59,662 | 6,473,544 | 1.6% |
| Russia | 187,859 | 1,194,643 | 1.8% |
| Mexico | 31,522 | 753,090 | 10.4% |
| Bangladesh | 13,134 | 366,383 | 1.4% |
| Indonesia | 13,112 | 295,499 | 3.7% |
| Pakistan | 27,474 | 313,984 | 2.1% |
Re-opening will most likely result in a rise of cases
Here is my prediction using a scale-free model. The total cases, time scale, relative size and time of peaks could not be accurately modeled.
Here is what happened in the U.S. after many states relaxed the rules around May or June.


No comments:
Post a Comment